On Wednesday, I pulled together some salary information from Cot's Baseball Contracts in an attempt to give some context to teams' overall future salary commitments. Check out that post for background, and bear in mind we are only talking about post-2014 payroll. With the benefit of receiving comments and thinking about what I wrote, I decided to utilize the information in a few more ways.
First, as I noted in a comment, simply summing the future obligations only tells part of the story. A better, more complete analysis would discount later-in-time salary to a present value. Dave Cameron had a great piece recently on Fangraphs discussing the way in which contracts for elite free agents have tended to tack on additional years at the back end rather than increasing average annual value for a shorter term. As he noted, baseball payrolls have grown at about 3.5% on average over the last ten years. That kind of inflation — in concert with the time-value of money — makes a future dollar less valuable than a present one.
The difficulty remains in arriving at an appropriate rate by which to discount the future obligations. While I am not equipped to undertake that complicated and inexact task, it occurred to me that there is another option: simply chart out the different possible rates to show what would occur at a given percentage. I chose to use a range between zero and ten percent because opening day payrolls have increased by around 5-6% over the last two years and because the reported infusion of TV money could theoretically lead to a jump in salaries. Bear in mind, though, that the higher end of the scale is exceedingly unlikely — it is a ten-year period, after all — and is really included for illustrative purposes.
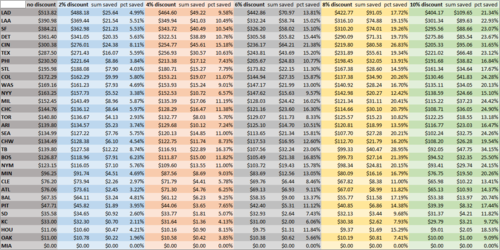
Here are the results, which show how different discount rates would impact each teams' future obligations. You'll need to open the image to view it.
[All numbers are in millions. An explanation on the columns: "x% discount" shows the present value of a club's future obligations at a given discount rate; "sum saved" shows the difference between the non-discounted obligations and the value as discounted; and "pct saved" shows the relative impact on each team's obligations at each rate. And I'll note that I updated the information to include the Rangers' recent extension of Martin Perez.]
Remember, there is nothing inherently good or bad about taking on, as opposed to avoiding, future obligations. And there are good reasons to backload, or frontload, those commitments. This is just a tool to help understand the numbers. Click below for a closer look at a few salient aspects of this chart, and some additional team-by-team information and observations.
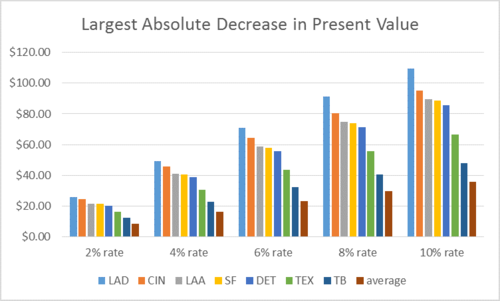
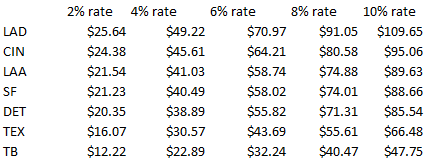
The most apparent impact of discounting applies, naturally, to teams with the most payroll to be discounted. That does not mean that low-obligation clubs don't care — after all, a low-inflation environment would increase the relative future burden on heavily-committed teams, to their competitve disadvantage — but their pocketbooks are relatively safe from the direct effects. In absolute terms, discounting most diminishes the present value of the down-the-line salary obligations of these clubs:
We'll keep our focus on clubs that have enough in future commitments to make the discount rate bite. You'll note that, as I mentioned in the first post, a greater discount — which, for our purposes, means an expectation of greater salary inflation — would ease the burden on teams whose obligations extend furthest into the future.
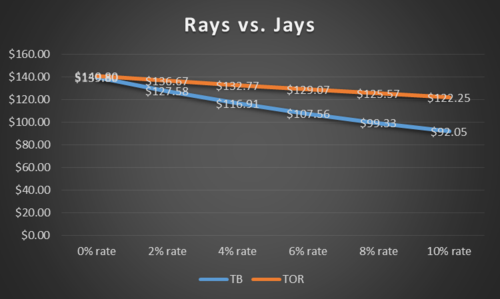
First, let's compare the Rays — who have the highest present value reduction, by percentage, upon discounting — with the Jays, who have one of the lowest. Both teams have about $140MM in post-2014 commitments, but look what the discount rate does to their present value as we increase it:
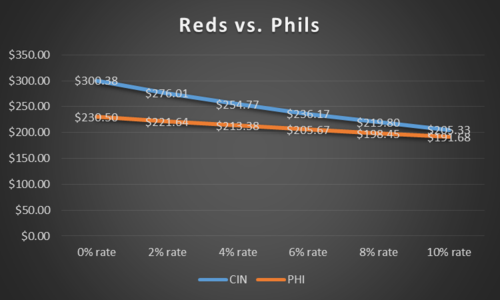
Clearly, unless we experience salary deflation, the Rays' obligations fall short of those borne by their division foes from up north. Likewise, going in the opposite direction, notice how the Reds' $300MM tab begins to creep down towards the $230MM owed by the Phillies as the discount rate is edged upwards:
Discounting is just one way in which the actual structure of the obligations — as opposed to a simple lump sum — makes a difference. Dollars that must be paid sooner cost more, but they also leave the books quicker. More money committed to fewer players increases risk, but (at least hopefully) reflects higher-quality assets. Likewise, a greater overall average annual value means that more roster spots remain to be filled, with less money available to do so.
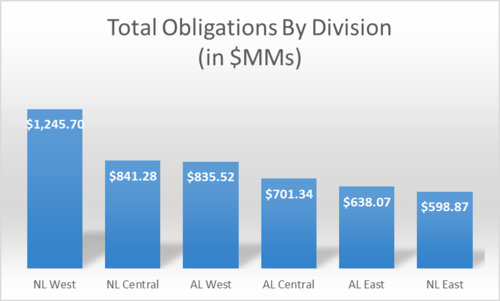
To help continue exploring these comparisons, I thought it would be useful to put together a few more graphs, with teams grouped by division. None of these figures are discounted, since as noted above I do not wish to stake out a specific discount rate. First, let's look at future obligations on a division-by-division basis:
It is certainly interesting to see the geographical spread, though a big off-season spree along the I-95 corridor could change things pretty quickly.
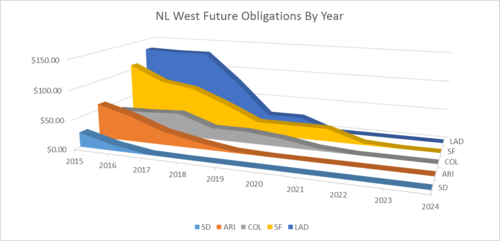
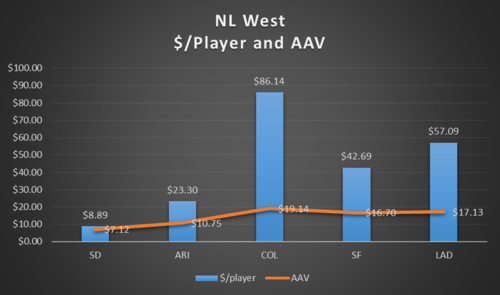
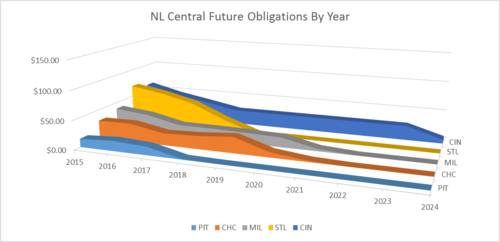
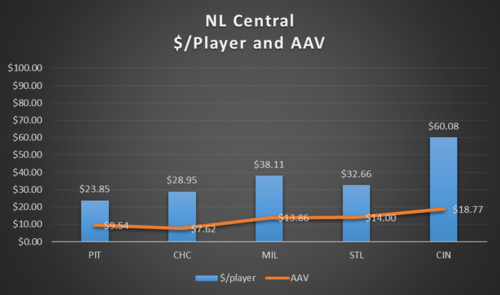
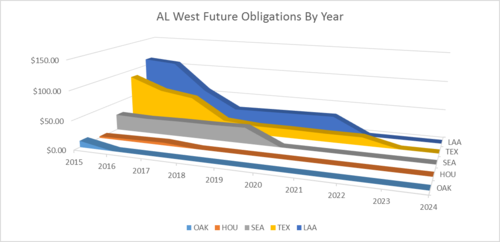
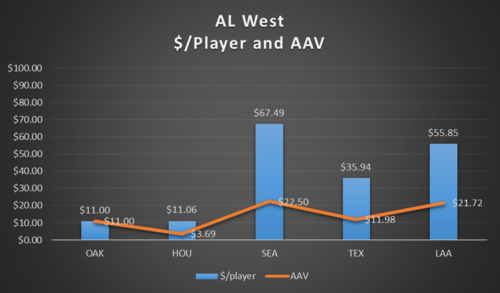
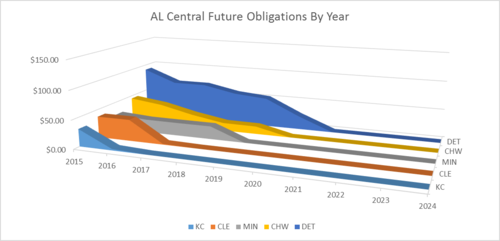
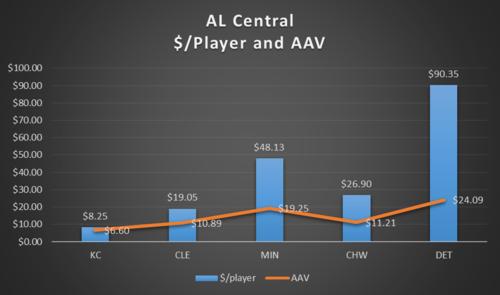
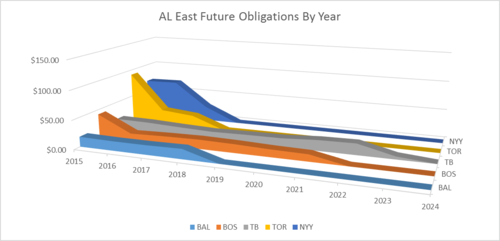
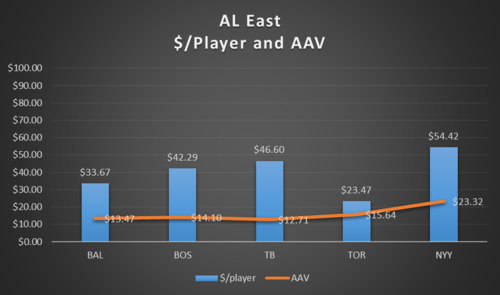
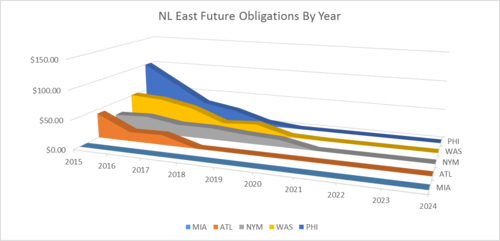
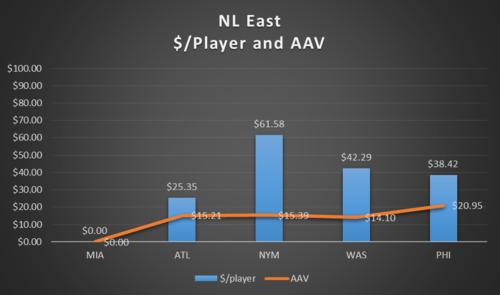
Now, let's look at each team by division, in descending order of total divisional obligations. I'll offer two charts with each division, the first one showing total obligations by year, and the second showing each club's average commitments per player as well as the average annual value of all its contracts. (Option buyouts count in the guaranteed salary, but do not count as a year for determining AAV.)
NL West
The Dodgers' massive commitments between 2015-18 ramp down rather suddenly, though a Clayton Kershaw extension could change that. The Rockies have one of the game's highest per-player commitments, but Troy Tulowitzki and Carlos Gonzalez are both elite players with plenty of prime years left.
NL Central
The Reds have the longest set of commitments in baseball thanks to the Joey Votto contract. Though the Cubs have a lot of money owed to some fairly risky assets (Edwin Jackson, Starlin Castro, Jorge Soler, Anthony Rizzo), the club maintains a low AAV. Pittsburgh has one of the cleaner sheets in the game; even better, most of its scheduled outflows will be directed to Andrew McCutchen.
AL West
The Angels' commitments look imposing when one considers the age and recent history of their most expensive players (Josh Hamilton and Albert Pujols), especially in conjunction with high commitment-per-player and AAV marks. The Rangers have a well-diversified and widely-spread set of obligations compared to most big-spending clubs. Essentially all of the M's commitments go to Felix Hernandez. Looking at the chart, it would be tough to pick out the team that actually won this division the past two seasons.
AL Central
With a series of massive contracts, the Tigers have the league's highest average commitment per player — and that is before new contracts for Miguel Cabrera and/or Max Scherzer come into play. The Twins and Indians provide an interesting contrast between two teams with approximately the same sum of future payroll promises.
AL East
These graphs show again the stark contrast between the Blue Jays' and Rays' obligations. Boston's future obligations look remarkably similar to Tampa's in size and structure, and each has a franchise player (Dustin Pedroia and Evan Longoria, respectively) that accounts for most of the hit. Given New York's massive spending capacity, its drastic payroll drop-off affords ample opportunity for backloading deals to free agents.
NL East
We've heard before that the Phillies' big contracts won't prevent them from spending and contending, and these charts show why that could yet be the case. Though the club carries a steep AAV, it will shed salary reasonably quickly. The Braves, dealing with the B.J. Upton and Dan Uggla deals, have perhaps more in common with the Phillies than one might think. Each will try to work through near-term financial crunches of similar proportion (in relation to their likely payroll limits) by relying on a strong organizational asset: money for the Phils and young talent for the Braves.
That's all I have to offer at the moment. I will be interested to see what other observations are reached in the comments.

Good stuff!