With the 2014 offseason upon us, there will be plenty of discussion of how prospective free agents, arbitration eligibles, and extension candidates fit into their teams' plans. To help assess all manner of prospective moves, I pulled together some of the wealth of data available at Cot's Baseball Contracts with an eye to putting it all in a broader context.
Alas, Wendy Thurm of Fangraphs beat me to the punch with respect to payrolls for the coming year, compiling estimates of each teams' 2014 salary obligations as they stand at present. (Thurm utilizes Cot's information, adds in recent signings, and incorporates the arbitration projections of MLBTR's Matt Swartz, then employs some judgment to reach her figures.) You'll want to give that piece a read.
But with the 2013 season in the books, Thurm's list is now a gauge of present commitments. When considering long-term contracts, possibly including back-loading mechanisms to obtain present production and pay for it later, it is also important to look down the line.
So, I offer the present figures, graphs, and observations to work in conjunction with the aforementioned breakdown. I have included only actual, guaranteed dollars (including buyouts) — i.e., no estimated arbitration obligations or pre-arb salaries. The result is not intended to be a realistic look at teams' complete commitments, but does reflect the amount of financial flexibility that each club has to work with. (After all, if an organization really cannot afford a player eligible for arbitration in, say, 2015, they have the option to trade them or cut them loose by a non-tender.) While I hasten to add that I lack the background to support a true statistical analysis of these numbers, I hope the following will give MLBTR's readers some interesting things to consider.
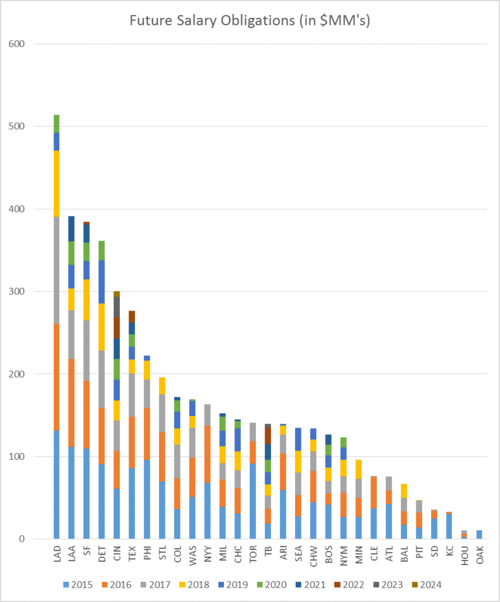
We'll start with a chart showing the entirety of every team's future guaranteed contract commitments. Deeming 2014 as present obligations, the year range is from 2015 to 2024. In total, MLB teams have signed deals promising players over $4.8 billion to play for them over the decade beginning in 2015. Total commitments* range from $513.82MM (the Dodgers) to $0 (the Marlins). Without further ado (click image to enlarge):
[*Amounts include obligations to players no longer under team control. Bonuses are spread over the life of a contract, as Cot's maintains its figures. The Dodgers' recent signing of Alexander Guerrero is reflected as providing four equal, $7MM salaries for the life of the deal since year-by-year details have not been reported.]
As the chart shows, the Dodgers have guaranteed over $100MM more to their players than any other team in baseball. A few other clubs immediately stand out at the bottom end, with the Athletics leading a group of near-term expected contenders (including the Royals and Pirates) with less than $50MM owed past the current year.
Click below for some more observations and figures …
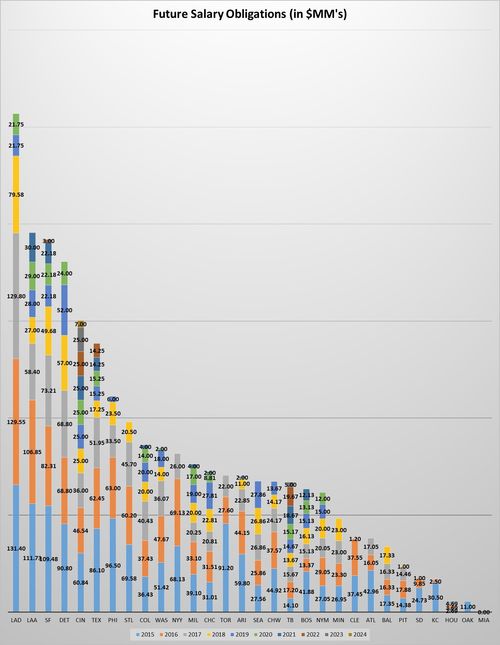
A full list of the future salary numbers is too unwieldy to include here, but you can click on this link to download an Excel file that has all of that data: Download Future commitments by team. For more visually pleasing access, here is a version of the chart showing the (rounded) payroll numbers by year, which you'll need to open in full view to really take in:
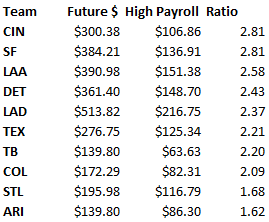
These numbers are interesting on their own. But baseball teams, of course, have widely varying payroll capacities. I therefore thought it useful to consider spending capacity as well. In need of a rough proxy for capacity, I chose to compare future commitments to teams' franchise-high opening day payrolls. That is surely an imperfect mechanism, but is good enough as a starting point. (For what it's worth, I ran the ratios using teams' average payrolls from 2011-13, and the resulting order was not materially different.) The following organizations have the highest ratio of future obligations to single-season high payroll (pre-2014):
Viewed this way, the Reds and Giants have perhaps extended themselves even more than the other larger-payroll clubs near the top of the list. The risk those clubs have taken is fairly substantial, particularly since much of their down-the-line cash is dedicated to just a few big-budget players like Joey Votto and Buster Posey. Much the same holds for the Rays, who have made a sizeable commitment to Evan Longoria; though he profiles as a substantial value, there is no question that his nine-figure contract carries extra risk to Tampa. (Compare Tampa's current balance sheet with that of the A's. It will be interesting to see whether the latter begin to add down-the-line commitments over the coming offseason.)
You could use these numbers to argue that some clubs have, to some extent, mortgaged their futures. On the other hand, of course, players under contract will (barring injury) provide production, even if it will likely decline over time. And another way of looking at things is that "high-ratio" clubs stand to gain the most from an inflationary salary environment.
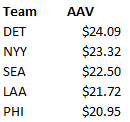
One team is noticeably absent from the above list: the Phillies, who are often mentioned as a team with troubling long-term commitments. Of course, that view is based in large part on a subjective assessment of the team's spending promises. Ryan Howard, in particular, looks to be a troubling burden. But the numbers do support some cause for concern as well, even though Philadelphia has a middle-of-the-pack ratio of 1.29. The Phils are among the teams that have committed the highest average annual value, meaning that their big commitments have bought them relatively few actual seasons of play. To wit:
[NOTE: the original version of this post contained an incorrect chart of teams with the highest AAV of 2015-2024 obligations. First, those figures included 2014 numbers. Second, the Phillies' calculation did not account for Miguel Alfredo Gonzalez, whose relatively low salary drops the AAV.]
Two clubs, then stand high atop both the ratio and the AAV lists: the Tigers and Angels. For the Halos, in particular, the numbers seem to support the concerns that many have raised about the club's long-term payroll burdens. Arguably possessing two of baseball's very worst contracts, the club's handling of Mike Trout — the game's most valuable asset — gains even greater importance.
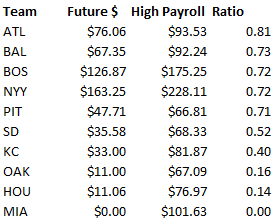
Looking at the ratio of future commitments to team-high payroll yields some interesting observations on the low side as well. In particular, among the club's with the lowest ratio are two notorious big spenders.
Sitting there amongst several clubs that have cleared out payroll or traditionally carry salaries below the top of the market, one finds two of baseball's most powerful organizations: the Yankees and Red Sox. Both have substantially less in total future comments than they have shown the capacity and willingness to spend in a single season. In other words, these two AL East powerhouses have plenty of room to backload deals. (For the Yanks, the luxury tax could still pose a challenge in the immediate term, though the club's relatively clear future ledger could help them dip under the line for a year to reset its tax hit.) That is probably good news for players hitting free agency this year and next.
It is worth emphasizing how well the Sox appear to be positioned in this light. GM Ben Cherington sent about $150MM in 2015-onward commitments to the Dodgers in the 2012 blockbuster (Adrian Gonzalez and Carl Crawford) and added just $13MM back in the club's free agent signings last offseason (Shane Victorino). Fresh off a World Series victory, Boston possesses upper level talent in a well-regarded farm system, wields some of the game's deepest pockets, and is carrying the long-term obligations of a rebuilding club. Cherington has earned his club a great hand; it will be fascinating to see how he plays it.

