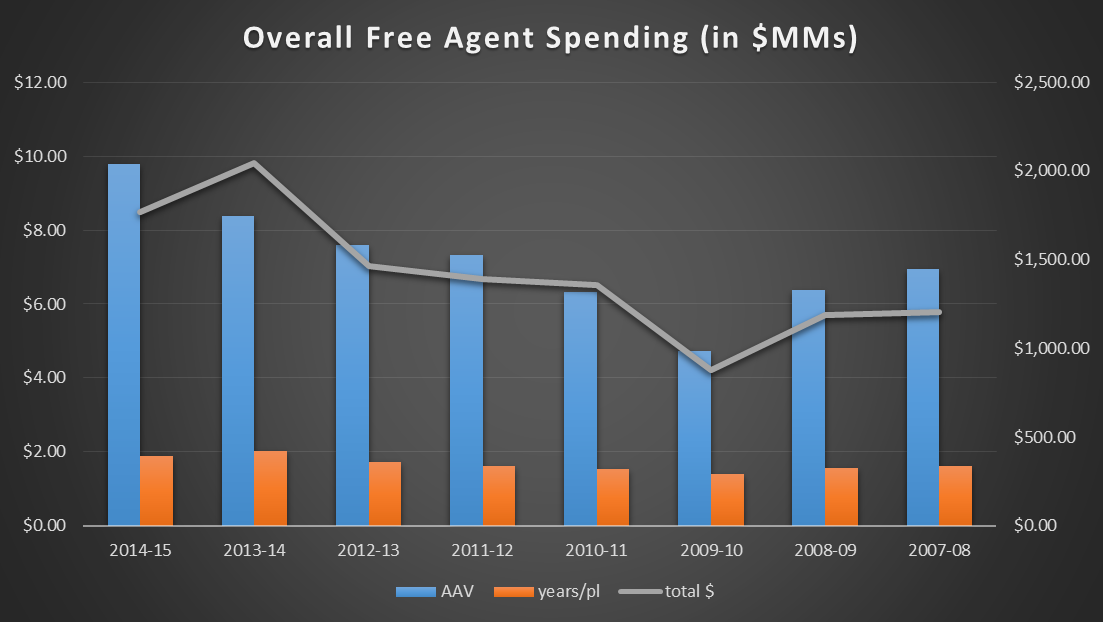
Last year, I compiled a whole lot of data on free agent spending to assess overall spending trends over the 2007-08 to 2013-14 time period. That post was the culmination of a lot of research, and includes plenty of observations about the broader period in question which I will not repeat here.
At the time, the 2013-14 spending season was not quite wrapped up. It was apparent that it would blow the prior years out of the water in most respects, and indeed that proved to be the case. After performing a complete update, the final tab is a shade over $2.043B in overall outlay.
So, how does the current (2014-15) market stack up? Though we may see a few more MLB deals, it seems a reasonable time to assess. I broke out spending by team yesterday, but that only shows us strategic choices across a single market. Now, we’ll look at the market as a whole against prior years.
The first thing you’ll notice is that the total spend has declined for the first time since the 2009-10 period. But as a glance further down the table reveals, that is almost certainly the result of the number of players available (among other factors) than it is some pull-back in spending.

Here are the annual increases and decreases; as you can see, last year’s market pushed a ton of total money over the prior season, but AAV actually grew more year-over-year this time around.
We’ll take a closer look at different classes of players (as I did with regard to the broader time period) in a separate post. But for now, take a look at the overall spending numbers isolated for multi-year contracts only. The total commitment per player and years per player both rose for those free agents who were marketable enough to secure pacts of two or more years in duration.


