Last year, I compiled a whole lot of data on free agent spending to assess overall spending trends over the 2007-08 to 2013-14 time period. That post was the culmination of a lot of research, and includes plenty of observations about the broader period in question which I will not repeat here.
Recently, I updated thing to assess the 2014-15 free agent market, which is in its very final stages as we speak. First, I broke out spending by team. Then, I looked at overall spending, noting that the total outlay had declined from the all-time high in 2013-14 but that AAV continued to rise.
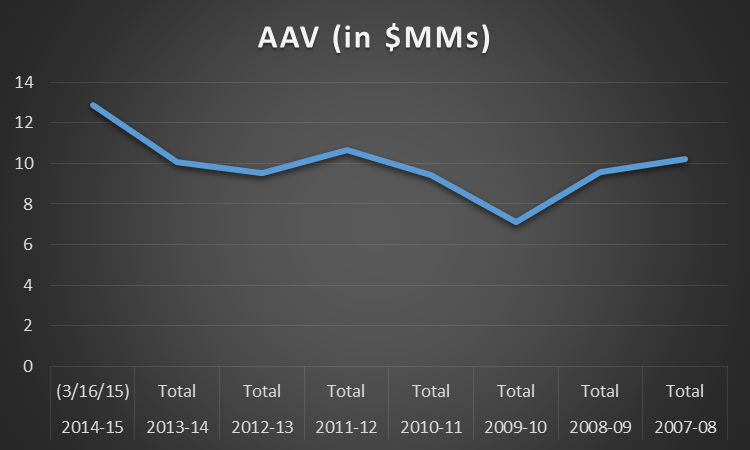
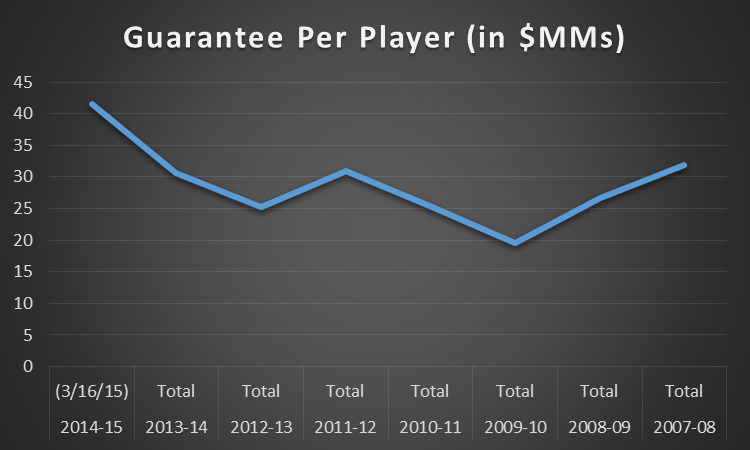
I also touched upon the trends as regards multi-year contracts, showing that the average total commitment ($41.59MM) and AAV ($12.85MM) for contracts of two or more years in duration had both risen significantly. That is particularly notable since that element of spending had remained largely flat over the 2011-12 to 2013-14 timeframe, even as the total number of players achieving multi-year commitments rose.
Here, again, is the table:
Now, let’s take a look in more visual form. The charts show a similar shape for both measures, and make clear that there continues to be healthy growth in spending on the game’s best players.
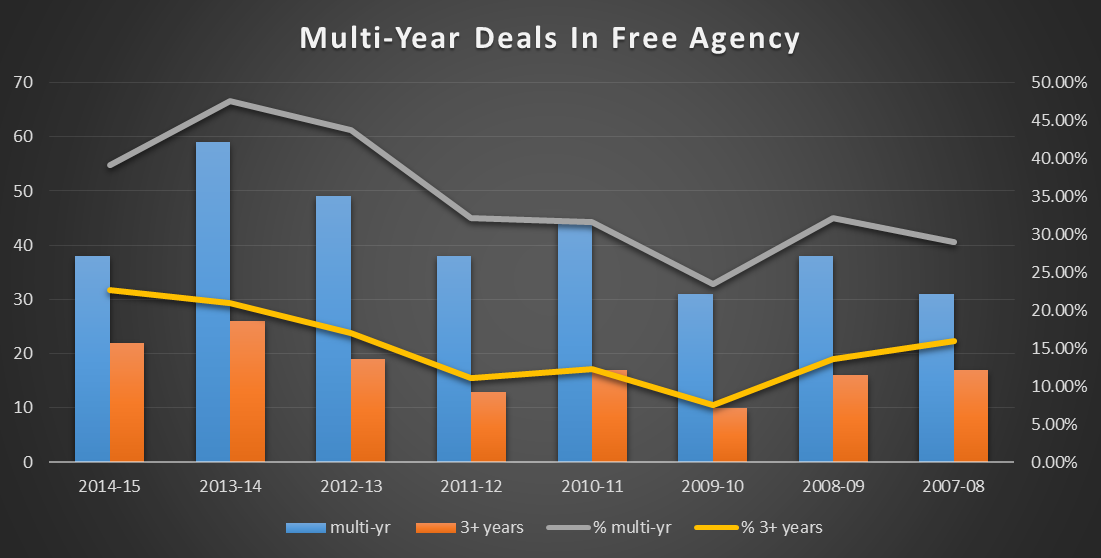
Of course, that only provides part of the story. As the data also reveals, this year’s market showed a rather significant drop in the absolute number of players who were able to achieve those kinds of commitments.
Previously, I showed only the multi-year deals as a group. Now, we’ll look at them in more detail. First, total contracts by year:
And now, by percentage:
There are several elements at play here. As I already discussed in my previous post, there were simply less MLB contracts given out this year, which does influence the absolute numbers. Nevertheless, less of those deals were of the multi-year variety. In particular, two-year deals fell rather dramatically. On the other hand, as the below table also demonstrates, the likelihood of a big league contract going for three or more years actually continued to rise (as a percentage of total MLB deals).
Here is the above table in chart form. It is largely impossible to make any definitive statements about the reasons for the step back in multi-year contracts, but it seems most plausible to hypothesize that the differences are due largely to the necessarily different group of free agent players available in each season.
What is most interesting, perhaps, is what the 2014-15 market tells us about how to interpret the 2013-14 market, which seemingly represented a rather substantial increase in all types of spending as the league continued to cash in on television contracts. As I noted then, however, variations in the market — if, say, Robinson Cano and Masahiro Tanaka had not been available, or if the Yankees had not chosen to spend big — could make things look quite a bit different.
That is the case this year as well, but in the inverse: many of the team’s highest-revenue teams (Yankees, Dodgers, Phillies, etc.) largely kept their money on the sidelines; there were no nine-figure foreign players; a previous extension prevented Clayton Kershaw from hitting the market as one of the most valuable free agents in history. And then there’s the fact that next year’s market appears to be loaded, with both top-end talent and depth. This spring has yet to produce a major extension for a 2015-16 free agent; if that class stays largely intact it should be rather interesting to check in this time next year.


