
We have previously set out the 2015 payroll starting points for every club. Now, we’ll turn to future obligations. Obviously, teams that intend to add long-term contracts will need to keep a close eye on these figures.
I took a look at this same information last year at roughly the same time (see here and here). As I explained then, discounting future obligations is unquestionably necessary for a true picture, but is also a practical impossibility (for this exercise) given its complexity and broad range of variables. The basic premise is simple, of course: the further away an obligation, the more the discount rate compounds, and the less that obligation is valued in terms of present dollars. (That assumes, of course, that we will continue to experience an inflationary environment; otherwise, the opposite would be true.)
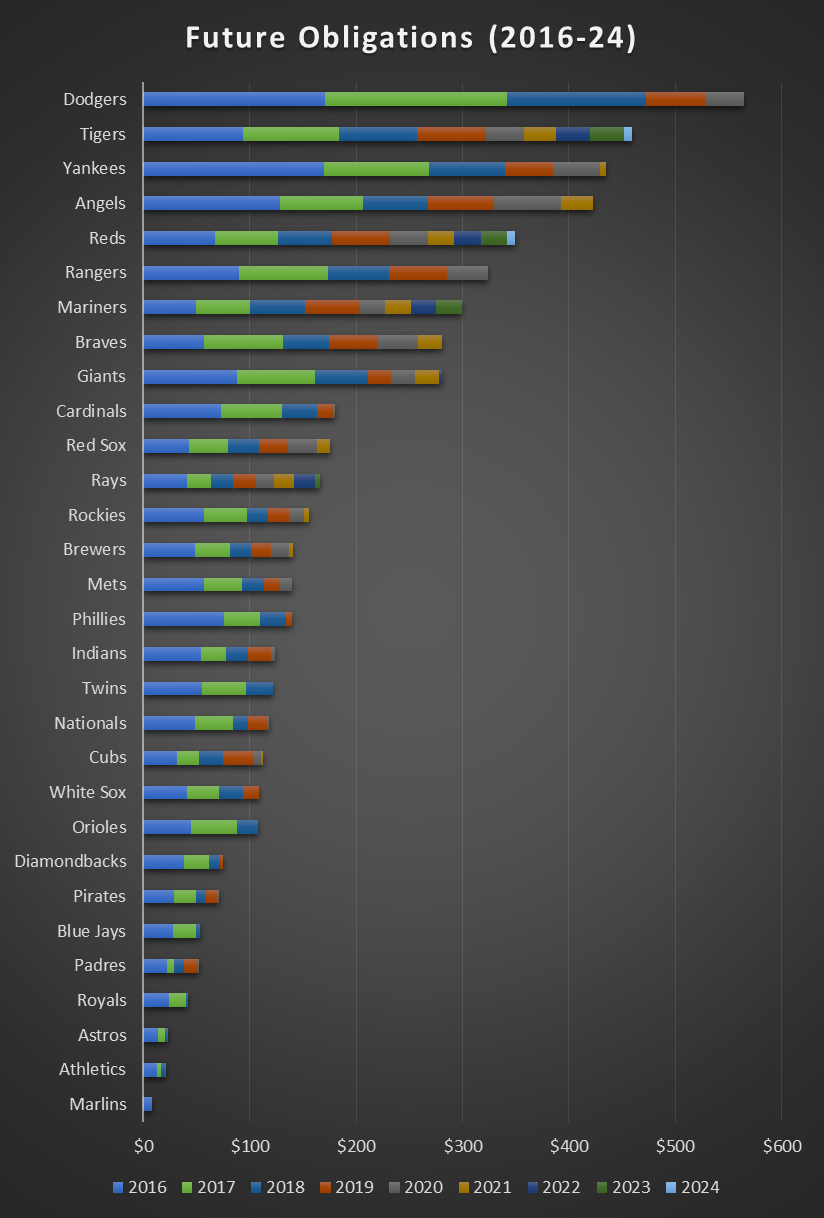
The future obligations chart and table that follow (all figures in $MMs) were compiled using the Cot’s Contracts database. That information reflects prorated signing bonuses, as is done for luxury tax calculations, so in that respect it may overstate (by a small amount) the actual budgeting situation for some teams. (Note also that the Tigers’ reported signing of Victor Martinez is not included; if that deal is consummated, it would add $17MM per season to Detroit’s tab over 2016-18.)
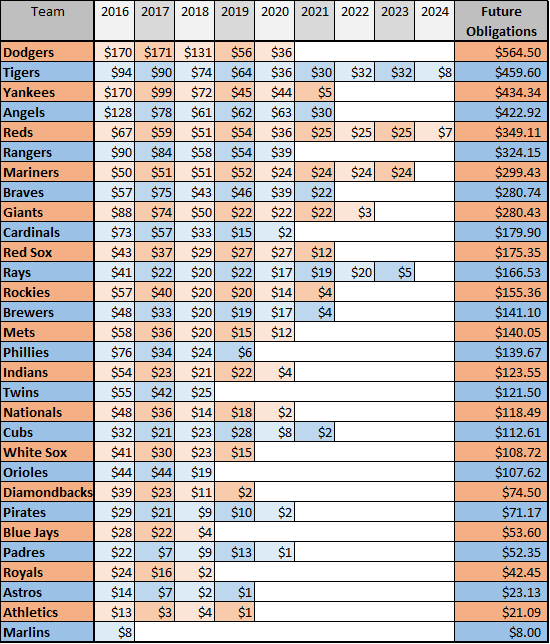
And in table form:
So, how have things changed since we last checked in about a year ago? Obviously there have been some significant commitments added and subtracted, and existing contracts are one year closer to completion.
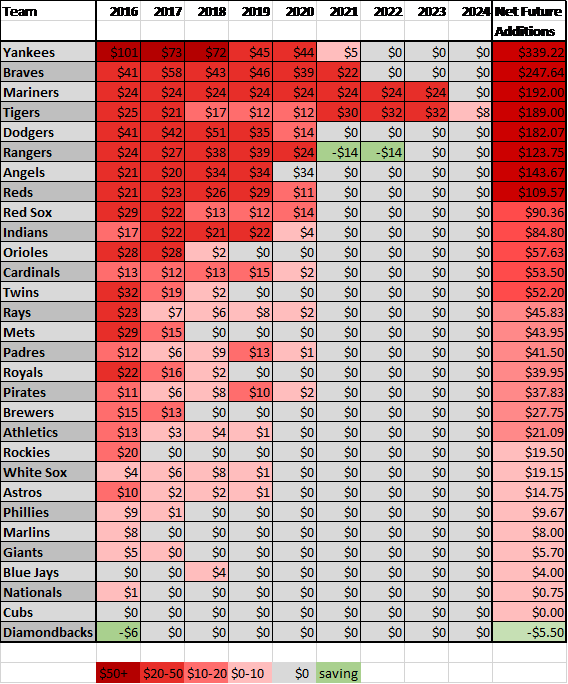
The following table shows how each team’s future balance sheet has changed on a year-by-year basis since last year (re-ordered highest to lowest):
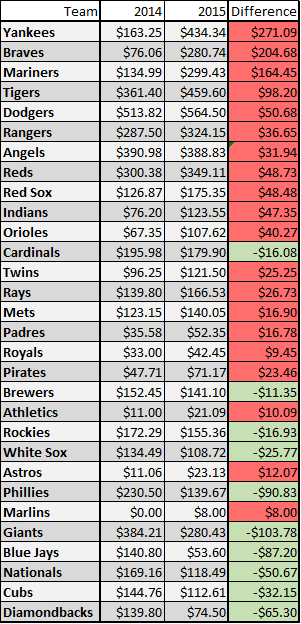
And finally, this table documents how each team’s total forward-looking commitments have changed from our last snapshot in November of 2013 (looking at 2015 and beyond) to the one taken this morning (looking at 2016 and beyond). In other words, the number you see in the column at the right shows you how much more or less in total future obligations a particular team is carrying now than they were at this time last year.
Great data set but that graph has so much information on it now its just a rainbow of confusion.
Personally, I think that chart is an awesome way to display so much data.
Where did 2015 go?
Yesterdays chart.
You can scroll through the article and find it.
Thanks. I didn’t realize it was a different post. Found it
Yeah, had to separate them b/c it was just too much ground to cover in one post. But the two definitely go hand-in-hand.
Awesome post! good job
Thanks!
excellent post. thanks a for the information.
What these data continue to demonstrate is that the Red Sox have no excuse for not making a long-term commitment to Jon Lester. Their long-term financial commitments are so much smaller than many of the teams they compete with most often (Yankees, Tigers, Angels, etc.), and they aren’t in line with the team’s massive revenue streams. Sign Jon Lester.
or they are being smart and not wanting to be the phillies of the AL East
The Red Sox have a looooooooong way to go before they get into Phillies territory.
If we go by the theory “You are what your record says you are”, these 2 teams have near identical win totals the last 4 years (Phillies 329, Red Sox 327)..
2 less victories, but 1 more title. I’ll take it.
Hey I certainly would too.
The Red Sox will be signing a lot of name players. Ortiz and Pedroia are no longer playing at a star level. And they don’t have any others that remotely can be seen as star players. Red Sox fans rank as possibly the most entitled-minded in MLB. They will not put up with a team of rebuilding players. That’s for people in Milwaukee, Cleveland and San Diego.
A few years ago they got rid of Crawford, Gonzalez and Beckett. Now they want guys like that back – and they will once again pay any salary amount they need to in order to get them. (Hanley, Scherzer, Lester, Sandoval, etc.) Here is where Scott Boras and friends swoop!
Ortiz and Pedroia not playing at a star level? Define “star level” for me. Pedey had a 4.8 bWar despite injury issues. Ortiz just seems ageless…Mookie Betts has now hit well at every level including the majors so Id say he has some star potential. The Sox fans had a bridge year in 2012? Not sure what entitles you to bash the Sox this way when seemingly you lack knowledge about the team.
I’m not a Sox fan per se (not a hater tho), but I really love the future projections for Mookie Betts. I see him as a future star.
Pedroia might not be the All-Star he once was but at least he, like many others on the Red Sox, aren’t signed to a crazy 10 year deal like all these other players. I do agree that the Sox need to add stars and players like Lester and Sandoval should be on the books.
Great!
Easy to see teams that have overextended themselves.
Took some screenprints and am saving this for future reference.
Or locked up Hall of Fame players long term in an upwardly spiraling labor market.
Sooner or later the music stops, and there are a few less chairs for those walking around to sit on.
The teams with the best players win and generate the most revenue. Sitting on cash in this business is stupid.
It will be interesting to see how the Blue Jays approach the coming years. With a payroll around 140M this season, they’ll have A LOT of wiggle room.
Well done, I love seeing this kind of stuff.
How come the Jays went up $4m in 2018? Did you not include Reyes’ buyout the first time you did it?
That appears to be the case, yeah.
The diamondbacks with that big -$6MM in commitments 😛 I also just realized that the Yankees literally only have Chris Young and Shawn Kelley coming off the books before purge of 2016.
It is only a minor error, but in light of the MVP award today, it is worth mentioning that Cot’s fails to include Mike Trout’s 2020 salary in its database. Add another $34M (or so) to the Angel’s future payroll obligations (but I am not complaining).
Darnit, I’ll edit.
How do the Marlins stay in business?
Yanks and Dodgers
I see you noted this doesn’t include the V-Mart signing but does it include the Bio Stanton signing with the Marlins? That’s the longest contract outlay out there right now.
It obviously does not (atleast I’m pretty sure). Miami only has 8 million in commitments next year, and none after that. If Stanton’s deal was included, they’d have atleast 25 million in commitments beyond 2015.
Marlins immediately jump from last to top 10 in terms of future commitments once the Stanton deal is signed.
If Giancarlo Stanton signs that $325m contract the Marlins are going to vault up the chart by almost 20 spots; that’s insane.