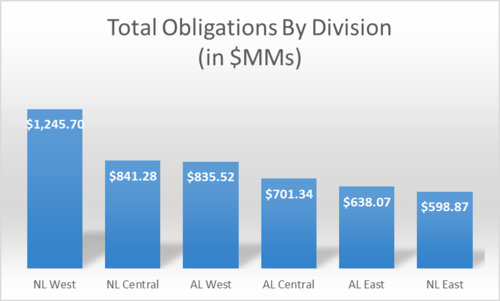
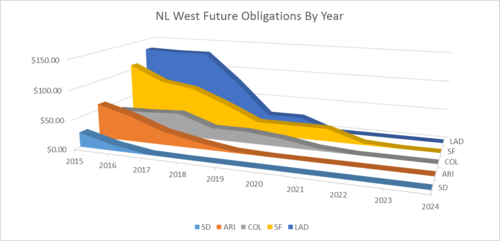
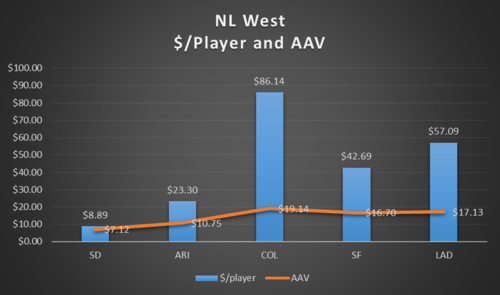
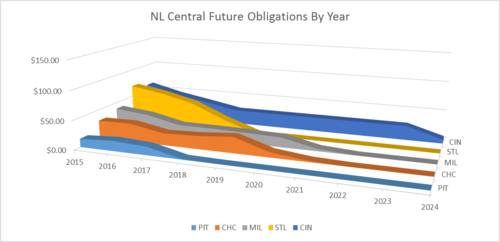
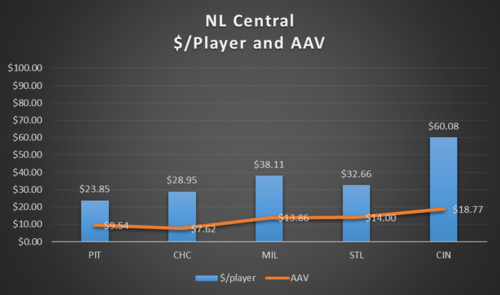
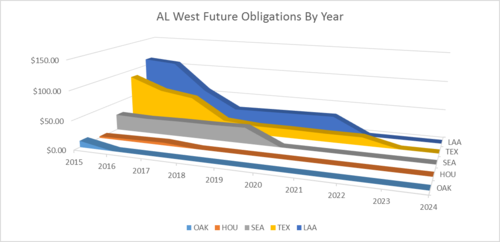
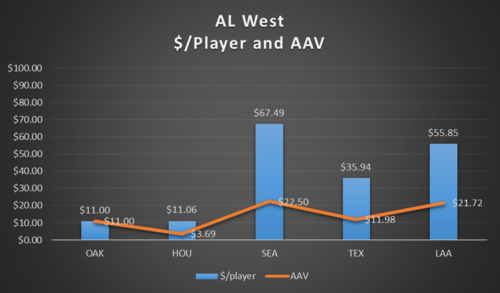
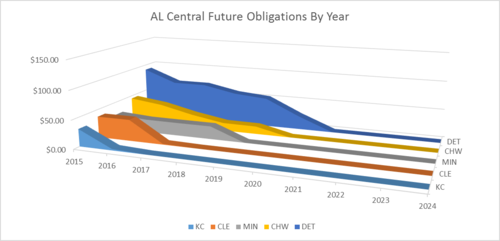
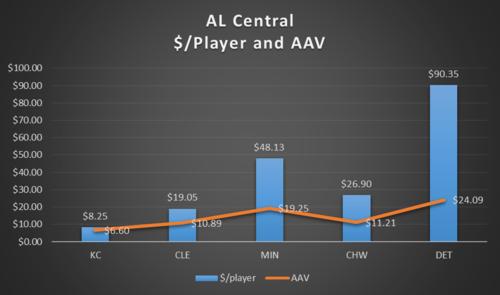
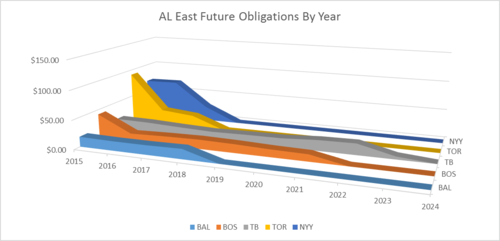
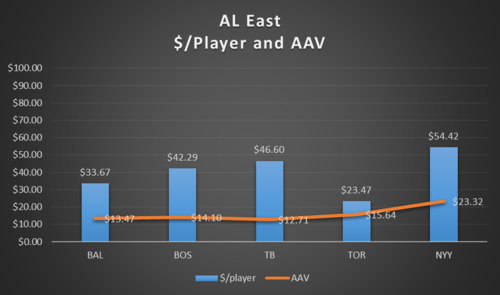
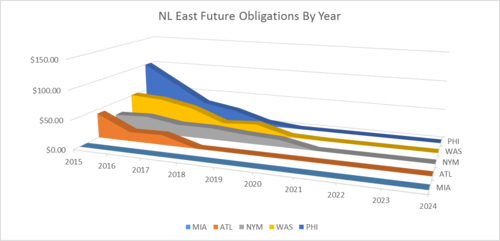
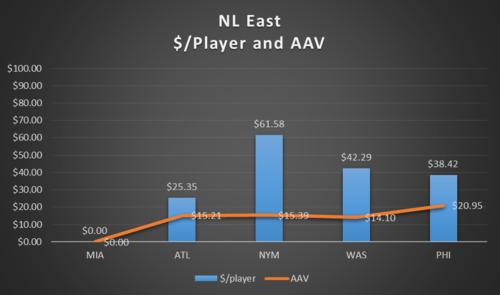
On Wednesday, I pulled together some salary information from Cot's Baseball Contracts in an attempt to give some context to teams' overall future salary commitments. Check out that post for background, and bear in mind we are only talking about post-2014 payroll. With the benefit of receiving comments and thinking about what I wrote, I decided to utilize the information in a few more ways.
First, as I noted in a comment, simply summing the future obligations only tells part of the story. A better, more complete analysis would discount later-in-time salary to a present value. Dave Cameron had a great piece recently on Fangraphs discussing the way in which contracts for elite free agents have tended to tack on additional years at the back end rather than increasing average annual value for a shorter term. As he noted, baseball payrolls have grown at about 3.5% on average over the last ten years. That kind of inflation — in concert with the time-value of money — makes a future dollar less valuable than a present one.
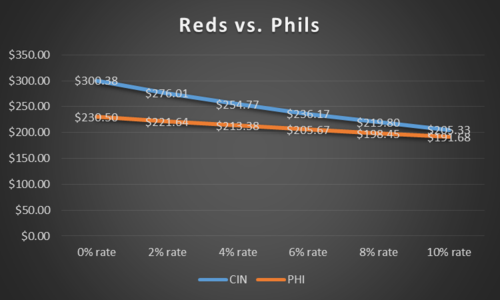
The difficulty remains in arriving at an appropriate rate by which to discount the future obligations. While I am not equipped to undertake that complicated and inexact task, it occurred to me that there is another option: simply chart out the different possible rates to show what would occur at a given percentage. I chose to use a range between zero and ten percent because opening day payrolls have increased by around 5-6% over the last two years and because the reported infusion of TV money could theoretically lead to a jump in salaries. Bear in mind, though, that the higher end of the scale is exceedingly unlikely — it is a ten-year period, after all — and is really included for illustrative purposes.
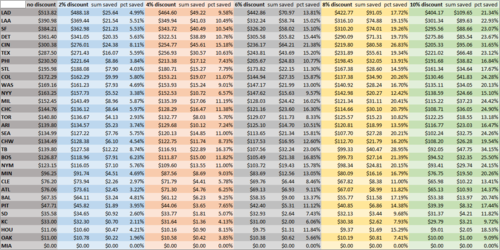
Here are the results, which show how different discount rates would impact each teams' future obligations. You'll need to open the image to view it.
[All numbers are in millions. An explanation on the columns: "x% discount" shows the present value of a club's future obligations at a given discount rate; "sum saved" shows the difference between the non-discounted obligations and the value as discounted; and "pct saved" shows the relative impact on each team's obligations at each rate. And I'll note that I updated the information to include the Rangers' recent extension of Martin Perez.]
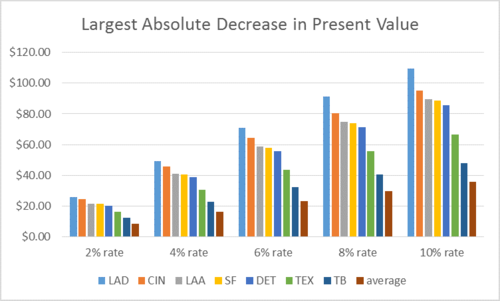
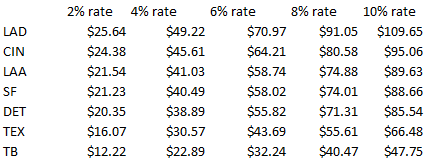
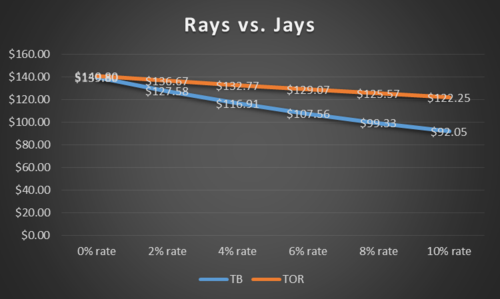
Remember, there is nothing inherently good or bad about taking on, as opposed to avoiding, future obligations. And there are good reasons to backload, or frontload, those commitments. This is just a tool to help understand the numbers. Click below for a closer look at a few salient aspects of this chart, and some additional team-by-team information and observations.
