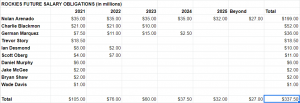
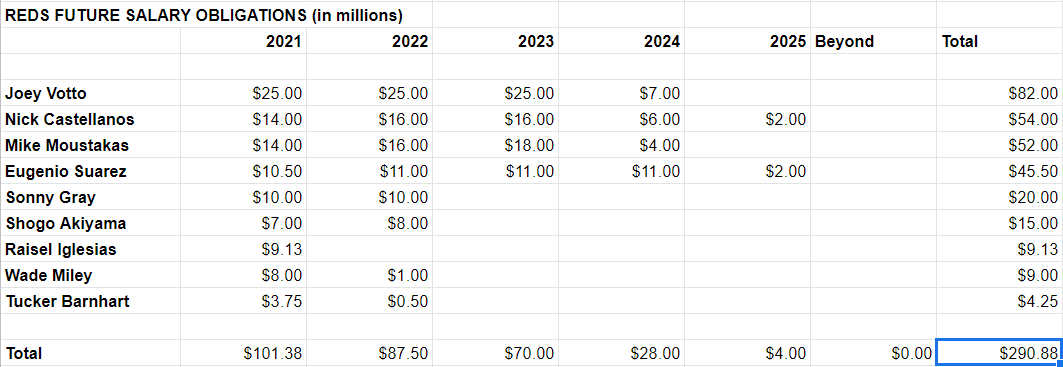
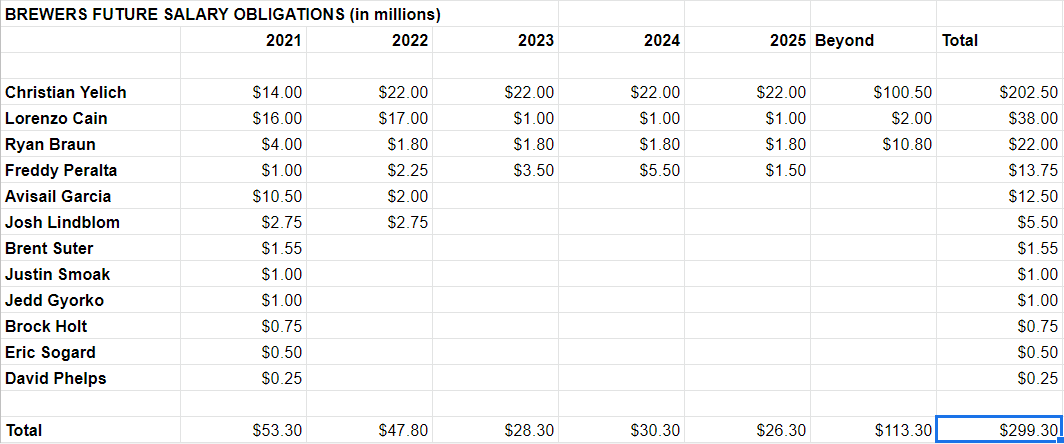
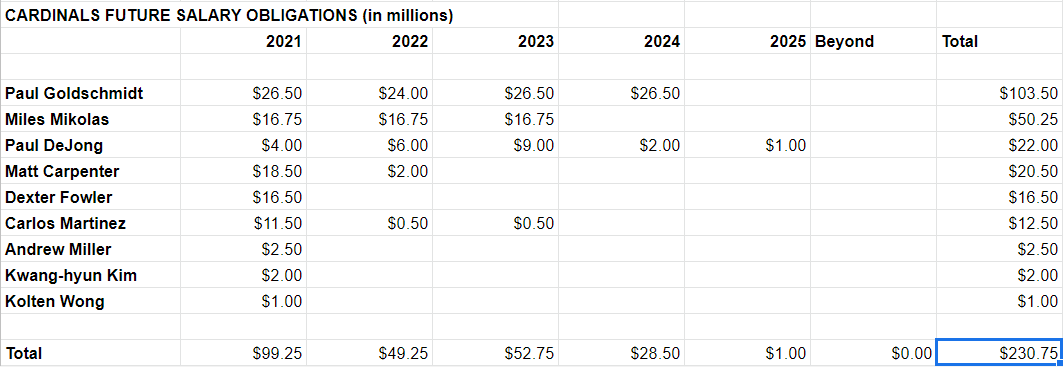
Recently, we ran through the full slate of future financial commitments teams have made to MLB players. As I explained throughout that series of posts, there are several different ways to look at salaries. Since the purpose of this exercise is to see where teams stand as we enter a period of massive uncertainty in the player market, we utilized actual cash still due beyond the 2020 campaign. That includes signing bonuses, deferred money, and money owed to since-traded players.
Every individual team’s breakout can be found at this link. Little has changed since, with one notable exception: the sizable Mookie Betts deal now resides on the Dodgers’ balance sheet. It’s reflected in the charts below. Now, we can put it all together to see how every team stacks up around the game. There’s over $7B in total future commitments tallied here. We’ll break it out in several ways (all charts in millions of dollars).
This chart shows total future MLB guaranteed contract commitments, in the aggregate.
|
Future MLB Contracts
|
|
| 2021 | $4,146.86 |
| 2022 | $3,459.90 |
| 2023 | $3,069.35 |
| 2024 | $2,730.37 |
| 2025 | $2,464.12 |
| 2026+ | $1,378.47 |
| Total | $7,134.08 |
And here we have each team’s total future commitments. These numbers would look different if we applied a discount rate, of course. Some teams with longer-fuse commitments (the Brewers and Dodgers, for example) would come out looking lighter. But there’s no single correct discount rate to apply, particularly in times as uncertain as these. So we’ll stick with a simple tally.
| Rank | Team | Total |
| 1 | Angels | $651.00 |
| 2 | Yankees | $612.00 |
| 3 | Dodgers | $533.36 |
| 4 | Nationals | $488.68 |
| 5 | Phillies | $488.50 |
| 6 | Padres | $396.00 |
| 7 | Red Sox | $355.85 |
| 8 | Rockies | $337.50 |
| 9 | White Sox | $317.75 |
| 10 | Brewers | $299.30 |
| 11 | Reds | $290.88 |
| 12 | Astros | $254.79 |
| 13 | Cardinals | $230.75 |
| 14 | Cubs | $228.50 |
| 15 | Braves | $204.53 |
| 16 | Mets | $201.00 |
| 17 | Diamondbacks | $166.43 |
| 18 | Twins | $154.02 |
| 19 | Giants | $129.15 |
| 20 | Blue Jays | $122.07 |
| 21 | Mariners | $115.45 |
| 22 | Orioles | $106.00 |
| 23 | Tigers | $102.00 |
| 24 | Rangers | $101.50 |
| 25 | Rays | $101.17 |
| 26 | Indians | $40.65 |
| 27 | Royals | $38.75 |
| 28 | Athletics | $37.00 |
| 29 | Pirates | $15.25 |
| 30 | Marlins | $14.25 |
The most interesting way to look at the numbers is to examine all the teams’ commitments in the same chart, by year. But that’s also tough to present in a legible manner. You’ll have to click on these to see all the details.
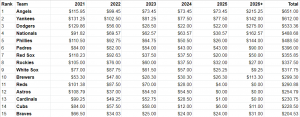
First, the top 15 teams by total commitments (link to expand):
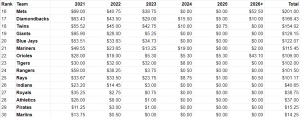
And now the bottom 15 teams (link to expand):

