We often speak of contracts in terms of years and total guaranteed money. And, of course, that shorthand tells us most of what we need to know about a given deal. But every deal is individually negotiated, and most contain additional terms that can have a substantial impact on the risks and rewards applicable to both parties.
In particular, option years -– of varying type, duration, and value -– are a critical component of many contracts. While the function of options is fairly well understood, it seems worth taking a broad view of their employment across the league. To that end, I have compiled* and categorized (as best I can) every single contract containing an option that was entered into between the 2007-08 and 2012-13 “signing seasons.”
It was relatively easy to determine a signing season for free agency, which begins at the point at which exclusive negotiating rights end for a player's former team. For extensions, which are defined as new contracts entered with players that are not free to negotiate with other teams, I determined that a signing season would begin at Opening Day for a given season. While this is a somewhat arbitrary demarcation, it seemed unwise to attempt the subjective task of determining when a player had accrued enough innings or at-bats in a new season for a team to reassess that player. And this approach allows ready comparison to the free agent figures. While the resulting lines that I drew can skew the results somewhat, I hope that this breakdown will be sufficient for a preliminary analysis.
Overview
For starters, we’ll consider the overall use of options of all kinds. Between the 2007-08 and 2012-13 signing seasons, 726 guaranteed MLB free agent contracts were agreed upon, 196 (27.00%) of which came with options. Only two of those, so far as my research could identify, contained more than one option year: the deals signed by Kevin Gregg and Scott Atchison in the 2009-10 season. This table shows the figures by season for free agent contracts:
Of the 301 extensions that were reached in that same time frame, 160 (53.16%) included options. Those 160 deals included a total of 202 option years, meaning that there were 1.26 option years for every deal that included some kind of option. This table shows the figures by season for extensions:
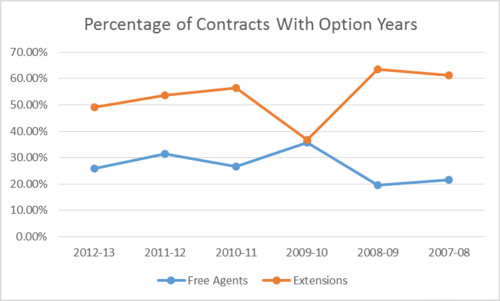
Clearly, and unsurprisingly, extensions are much more likely to come with options attached. Twice as likely, as it turns out. (And, as we'll see in a later installment, options in extensions are almost always straight club options.) Primarily, no doubt, that is a reflection of the fact that teams have much stronger bargaining positions with respect to players who have yet to qualify for free agency. The strongest motivations for teams guaranteeing future money for players who have yet to reach the open market are extending control, achieving cost savings, and obtaining cost certainty. In exchange for achieving such goals, teams often demand the right to achieve upside and retain flexibility in the event of injury or performance decline.
The 2009-10 Confluence
Of course, as the astute observer will note, there is one very interesting exception to the overall distribution: the 2009-10 season. As this chart shows, the sudden equalization of the use of options between free agent and extension contracts is quite out of line with the surrounding seasons:
So, what is the explanation for that shift? The most obvious explanation would seem to be the broad international economic downturn, which added an element of uncertainty to all of baseball’s dealings. Prying an option year from a free agent can be expensive, and teams may have been less willing to commit cash to get the upside of an option. On the other hand, the risk and uncertainty hit players as well, which may have increased club leverage to demand options in the extension context.
Alternatively, or additionally, it could just be that early, market-setting deals paved the way for an odd year. Utilizing comparable contracts to set parameters for other deals can lower the transaction costs and even the perceived risks for parties. If the most relevant models for contract structures tended not to include options, there may have been a copycat effect.
The 2011-12 Multi-Option Boom
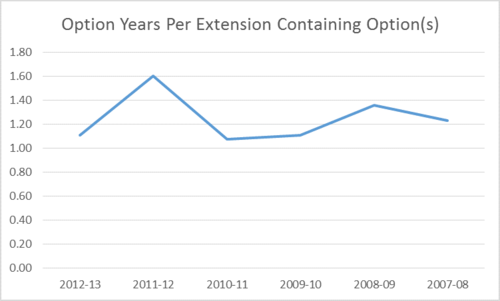
One other figure that stands out from the above tables is a seemingly aberrational year in terms of the number of option years per option contract in the extension bucket. Take a look:
For the 2011-12 signing season, the average option deal suddenly included over 1.5 option years. Three option years were agreed to with Salvador Perez, Sergio Santos, Jose Tabata, and Wade Davis. And a host of players, including Gio Gonzalez and Clay Buchholz, gave up two option years.
Once again, I am far from certain of the proper explanation for the shift. It could be (as noted above) that a few teams and agents simply followed early trend-setting deals. Once the extension market was established, players with around one service year tended to give up three option years while those with around two service years generally signed deals with two options.
Alternatively, industry financial trends may be the cause. Teams may have aggressively worked to extend control before anticipated TV revenue inflows changed market perceptions, choosing to make substantial guarantees in exchange for option years that cover free agent-eligible seasons. Or, somewhat alternatively, teams may have decided to commit portions of their expected new cash before it started to flow, utilizing it to lock up option years.
Whatever the reasons for it, the 2011-12 boom in lengthy option terms may have lent to the general industry perception that teams are increasingly locking up younger players to longer-term deals that enhance team control. But, as the graph shows, the numbers returned to approximately historical levels in the 2012-13 signing season. It will be interesting to see where things head moving forward.
—
Of course, it could be that options are such a negotiation-specific element that seeming patterns really tell us relatively little about how the market is moving. Either way, I hope that this broad look at recent option usage provides a reasonably useful descriptive account.
In the next installment on options, we will break things down by option type to look at how varying forms of options are utilized in the market.
*Starting from the MLBTR transaction and extension trackers, I built out the dataset by mining Cot's on Contracts, Cot's data on non-active players from Baseball Prospectus player cards, and ESPN.com's free agency tracker. I then supplemented those results with internet searches to resolve any conflicts among the various sources and to identify, to the extent possible, any missing information that may have fallen through the cracks. The MLBTR trackers will be updated to reflect the complete information utilized in this and future posts.


One needs to be careful beginning a paragraph with “For starters” when writing about baseball 😀
I tend to believe the 11-12 bump was due your ” industry financial trends”. Teams saw the coming wave of cash and started spending the money before players started expecting it. Once a guy sees a bigger pie he’ll battle for a share of it, but he might take a little less if he’s thinking in terms of this year’s revenue while being offered an option three years out. And even if there is no difference in the dollar value of that year, simply getting it as a team option rather than guaranteed can make a huge difference if a guy breaks down.